The North Sea plays an important role in the energy transition as a site for wind farms, solar power generation and carbon dioxide storage. This is why TU Delft draws traffic at sea.
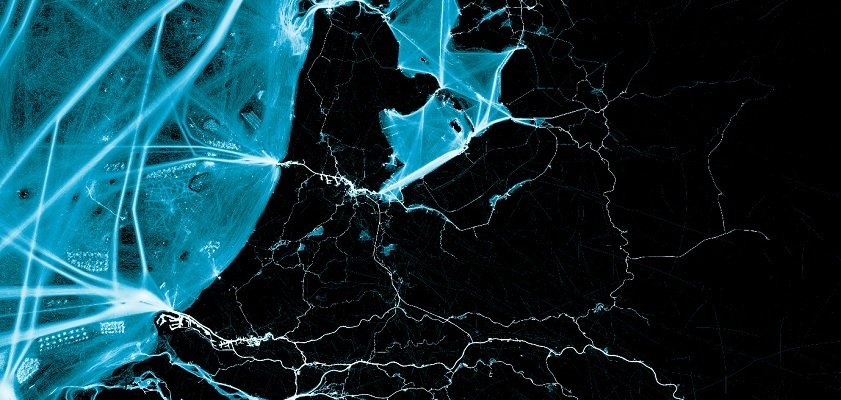
There are many plans for the North Sea. It can be a site for building an airport or housing on floating islands and of course the North Sea plays an important role in energy transmission as a site for wind farms, solar power generation and CO2 storage. But is there enough space for all the plans? Is it possible to combine different functions? Solange van der Werff (TU Delft) and colleagues have developed a detailed map to provide insight into how busy the North Sea is.
berries in detail
Thanks to the new visualization method, traffic in the North Sea and in inland waterways is now more transparent. On a large scale, it is easy to see what space is actually being used and by zooming in, you can see what kind of activities are taking place in that space. The high resolution of the map makes it possible to distinguish patterns and identify specific marine activities.
Van der Werf: “Our new map is so detailed that individual windmills can be identified. We can trace that back to the ships doing the work there.
Millions of ship locations
To develop this map, Van der Werff uses a data set of 4 billion ship locations collected over a 4-month period. This data is part of the Automatic Identification System (AIS). Rijkswaterstaat collects this data on Dutch waters and has made available a dataset for this research. With this system, other ships can read the location, course and speed of ships, but also of traffic and port services. In this way, AIS helps direct the charge in the right direction and improve safety on the water.
New computing power
The huge amount of data obtained with AIS could have been presented before, but the computational ability limited the accuracy with which this could be done. One pixel previously corresponded to an area of several hundred meters. Van der Werff and colleagues from TU Delft and Deltares are now using Microsoft’s new computing facility to advance global sustainability: the planetary computer. Thanks to this supercomputer, along with the AIS dataset, a single pixel equals a few meters in the new tool by Van der Werff and his team.
Space for future plans
This map is a valuable means of visualizing the existing situation; The next step is to simulate changes based on the knowledge gained. This allows analysis of ships’ trajectories and speeds, which in turn also provides insight into traffic safety and ship emissions. This approach provides a better answer to the question of whether there is enough room for future plans at sea. Our collaborating partners are very excited about the result so far, says van der Werf.
This project is a PhD research by Solange van der Werff at TU Delft, which she is conducting within the Department of Ports and Waterways under the supervision of Professor Mark van Koningsfeld. For her research, Vander Werff works closely with Rijkswaterstaat, Deltares and MARIN.

“Coffee buff. Twitter fanatic. Tv practitioner. Social media advocate. Pop culture ninja.”


More Stories
Which can cause an increase in nitrogen.
The Central State Real Estate Agency has no additional space to accommodate Ukrainians.
The oystercatcher, the “unlucky national bird,” is increasingly breeding on rooftops.